Hi all,
I just wanted to share here some info about the data management and documentation tools we’ve been working with the the SteeleLab (triggered by a question by @Leila)
Here, you can find a diagram I wrote up recently about the ICT infrastructure we use in my group for ensuring uniform data integrity and access:
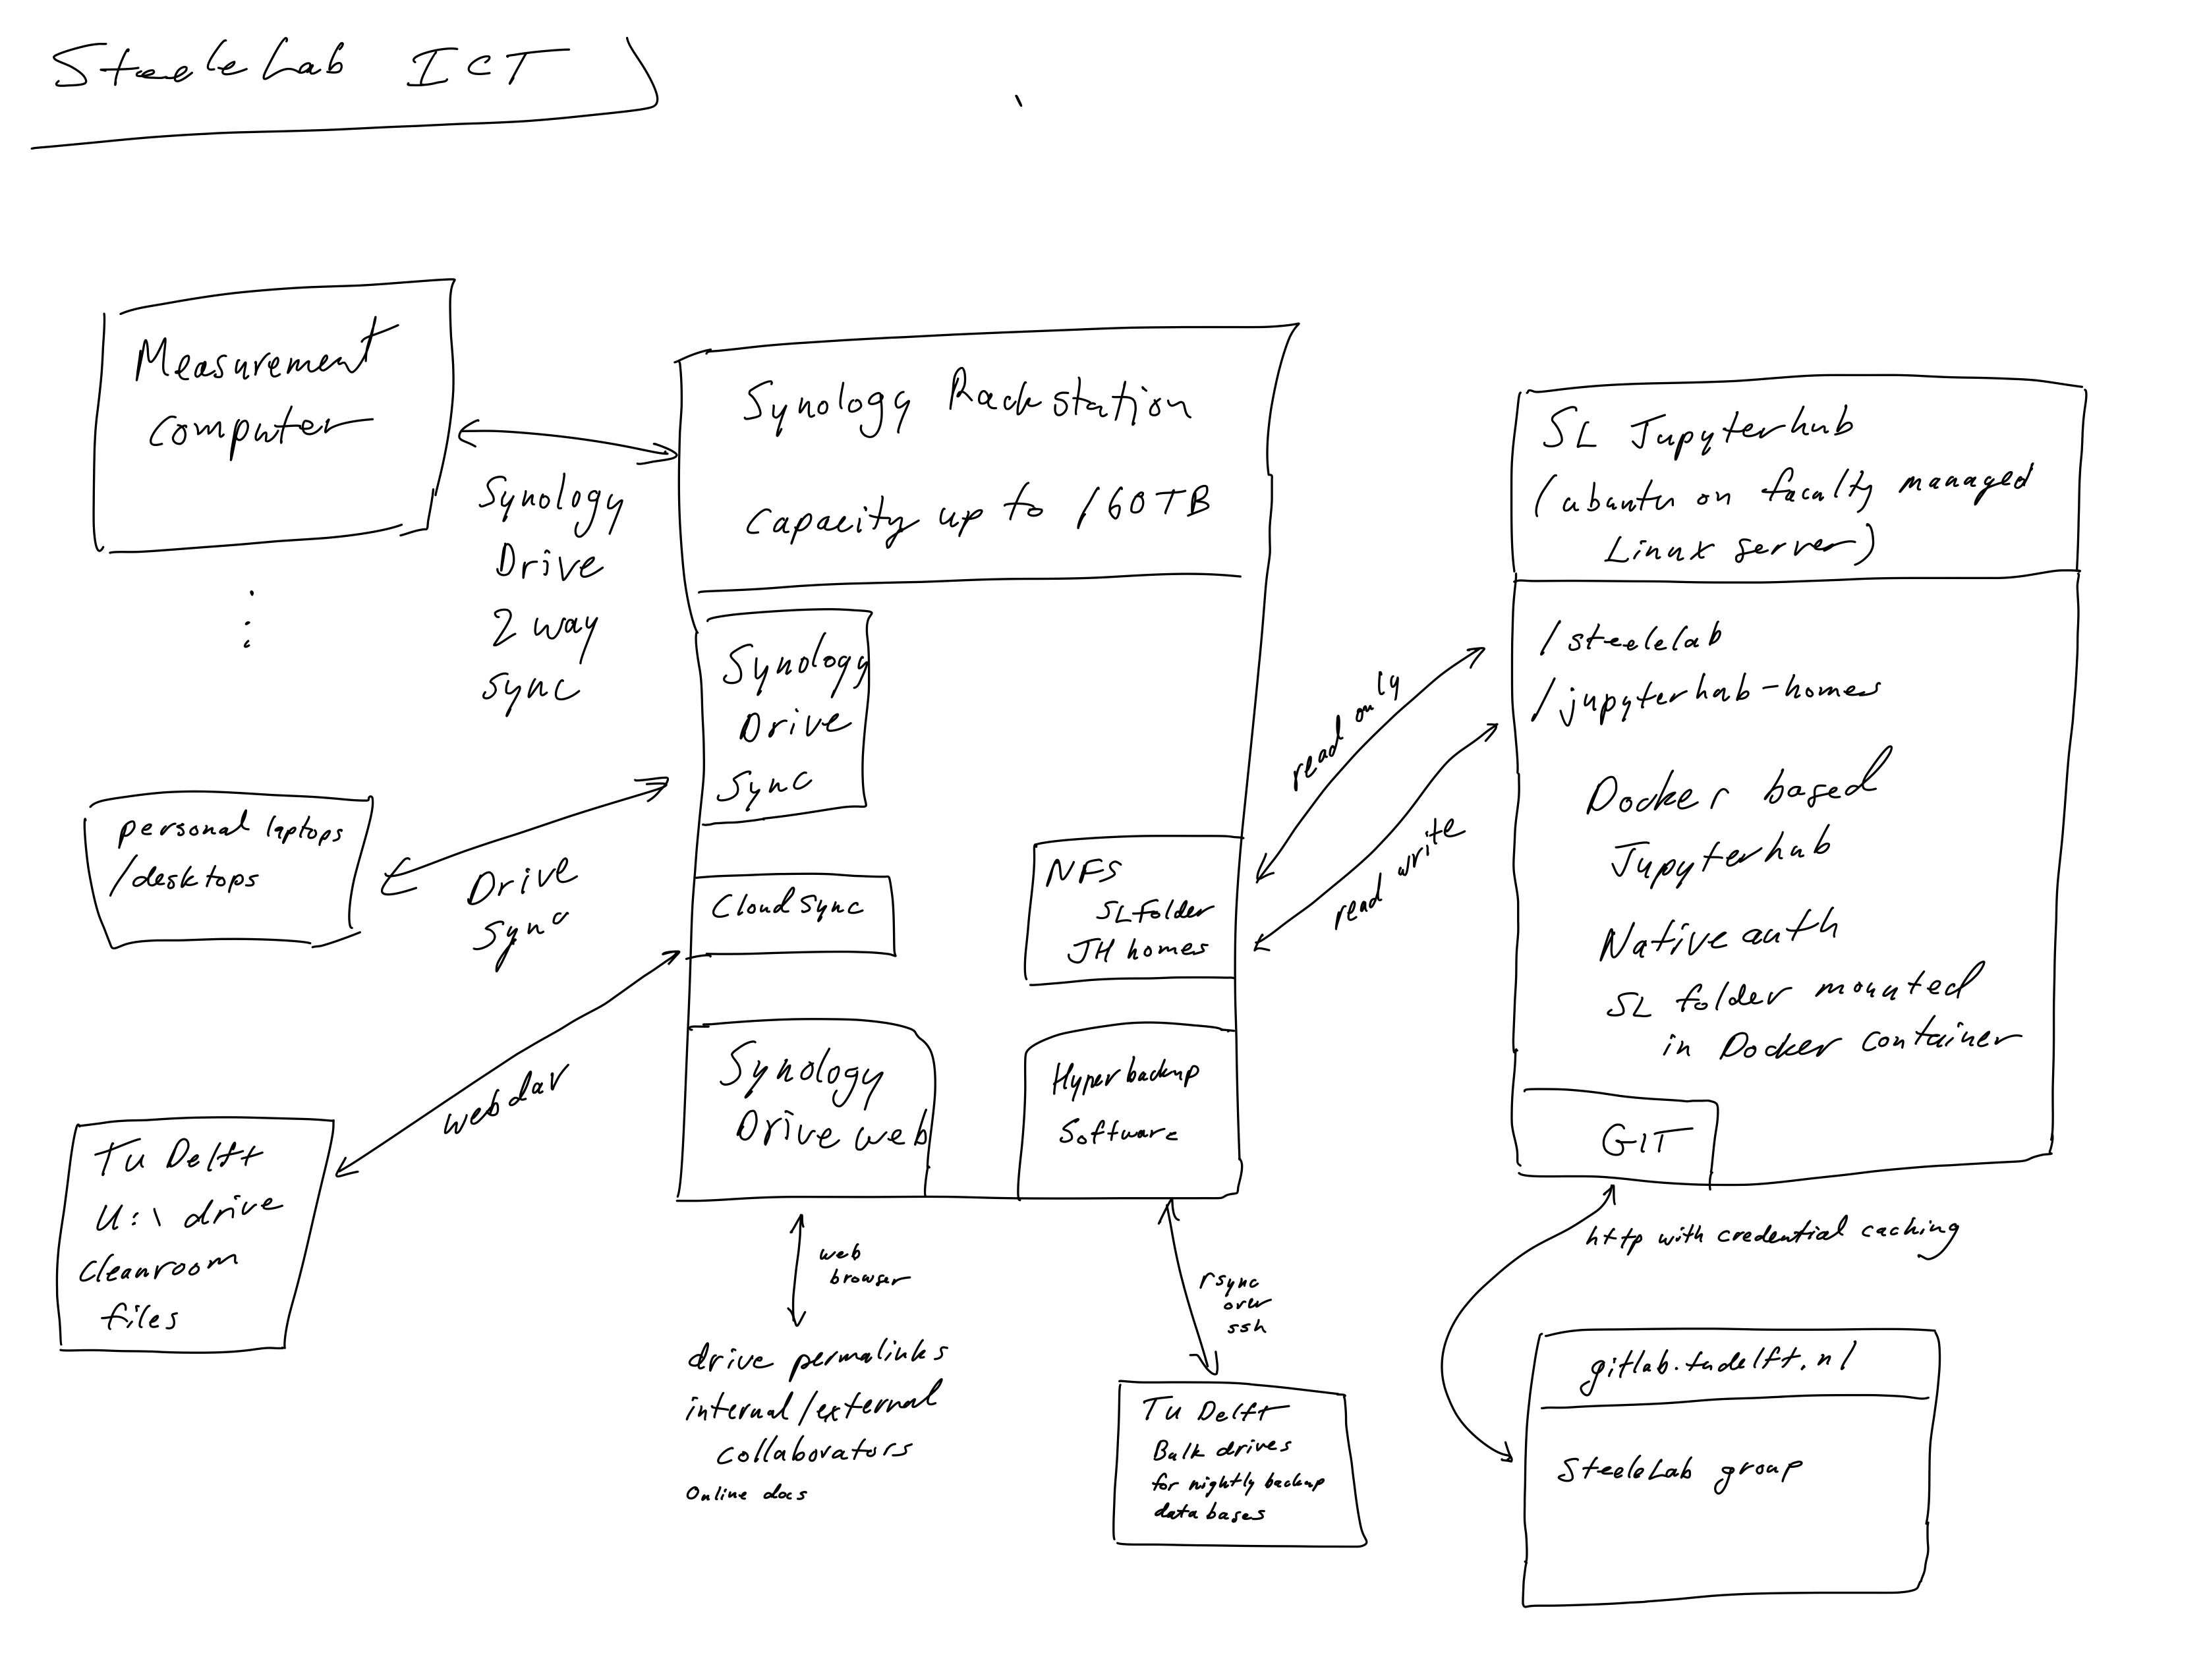
I am happy to describe a bit more about how it works (it is based on a Synology rack station that I bought and administer myself personally).
Also, I’ve been working on a project to create an dynamic, automatically generated jupyter notebook for documenting datasets. The idea is that on our jupyterhub, I can recursively search a folder path for all .dat files, and then create a jupyter notebook that includes a markdown header for each, a code cell that plots the data, and a markdown cell for entering notes about the data. In my latest incarnation, it is also able to regenerate the notebook based on an updated list of files while still preserving the generated plots and the hand-added notes. I hope to find some time to tidy this up into some simple-to-use code, but you can find already some of my “prototyping” notebooks here:
SteeleLab / logbook-generator · GitLab
It also build on a library called ‘datacube’ that I’ve been working on for automatic parsing of metadata for multidimensional (currently 4D) datasets with simple routines for static and dynamic interactive line and colorscale plots of the datacube:
I would classify it now as “alpha” but rapidly evolving. I use it in the latest concept code for the dynamic notebooks:
Files · master · SteeleLab / logbook-generator · GitLab
Right now, the dynamic plotting in datacube uses matplotlib with the notebook driver, but I find it very flaky…I’ve recently learned a bit about live interactive plotting with Bokeh, and will probably rewrite the interactive bits at some point in Bokeh.
BTW, if you are interested in fast live plotting, you can also check out this mega-alpha code I’ve been playing with for live plotting of data acquired with a red pitaya board:
Files · master · Python for Applied Physics / rp-squid-python-code · GitLab
Cheers,
Gary