I have a question for quantum dot people:
I realized there is a discrepancy in the QD community on how to evaluate a current derivative for charge stability diagrams. When I calculate this derivative, say my axes are voltage on plunger gate 1 (V_{PG1}), voltage on plunger gate 2 (V_{PG2}), I get the derivative as \frac{\partial I}{\partial V_{PG}}=\frac{1}{2}\left(\frac{\partial I}{\partial V_{PG1}} +\frac{\partial I}{\partial V_{PG2}}\right).
This is the way most groups I know calculate it - it makes the value robust towards being really unlucky with the direction of your charge transition line. However I was just discussing with a colleague and all the exp groups she works with tell her to take only one gradient instead of averaging the two directions (for example just: \frac{\partial I}{\partial V_{PG1}}).
Is there some convention of when people take average and when only one derivative? Is there a good reason to do one over the other?
This is not the answer you’re looking for probably since I don’t measure conductance in my group, but maybe is just another perspective. When I measure a double quantum dot, I use high frequency (GHz-level) resonators connected to the plunger gates of one of the dots. This resonator’s resonance frequency is perturbed by the ‘parametric capacitance’ of the double dot, given roughly by edn/dV_PG for that dot (where n is the electron number expectation value for that particular dot) which we indirectly measure. Hence, in my case, it is really true that we only measure the derivative of charge along a specific plunger gate axis (as described eg. here [1812.06056] Small-signal equivalent circuit for double quantum dots at low-frequencies).
So, interestingly, in my case, it is actually an experimental fact that we get ‘unlucky’ with only seeing the transitions which vary charge as a function of a specific plunger gate voltage :^)
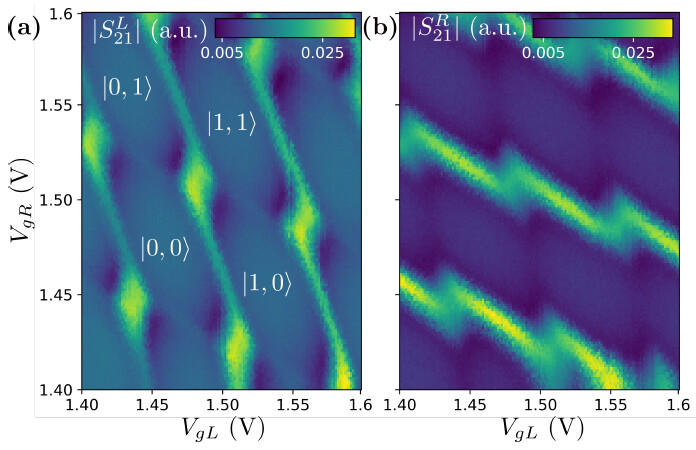
As an example, here is such a scan measured with both the ‘left’ (L) dot’s and ‘right’ (R) dot’s resonator simultaneously:
Here you can clearly see that each resonator’s signal is only sensitive to transitions involving its coupled quantum dot.
Sorry this does not answer your question but I was excited that a topic on this forum was somewhat related to my research 
1 Like
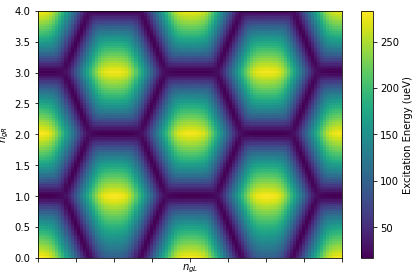
If your goal is to just clearly delineate the boundaries between different charge states in a stability diagram, the energy difference between ground and first excited state is the quantity myself and colleagues often use for visualization, by the way (ignore that this is a stability diagram for a strange triple dot system):
1 Like
Thank you @cprosko! This is very useful perspective - and nice stability diagrams! 
1 Like
Hello Eliska,
I’m a postdoc working in a spin qubit group. I could say that for most of us, we are not so much interested in the absolute value of the derivative, but mostly in any metric to delineate the edges of the charge stability regions. I’ve seen many ways to do this, including:
- Numerical derivative vs the gate you sweep (most common)
- Analog derivative vs the gate you sweep using a small ac signal on top of the gate voltage; (and many variations on the theme, including some where the ac is not on any gate you sweep, as is the case with the high frequency resonator above)
- Even people not taking the derivative at all!
The distinction is usually important only when trying to extract physical quantities like tunnel coupling, or perform single shot spin/charge readout.
Best,
Patrick
1 Like